
I am a Senior Application Developer at Regeneron Genetics Center. I completed my PhD in Computer Science from Northeastern University. During my PhD, I developed systems and tools to support web-based analysis of complex and large datasets. My research has contributed to novel systems and tools in the domain of genomics, medical diagnosis and cybersecurity.
Projects
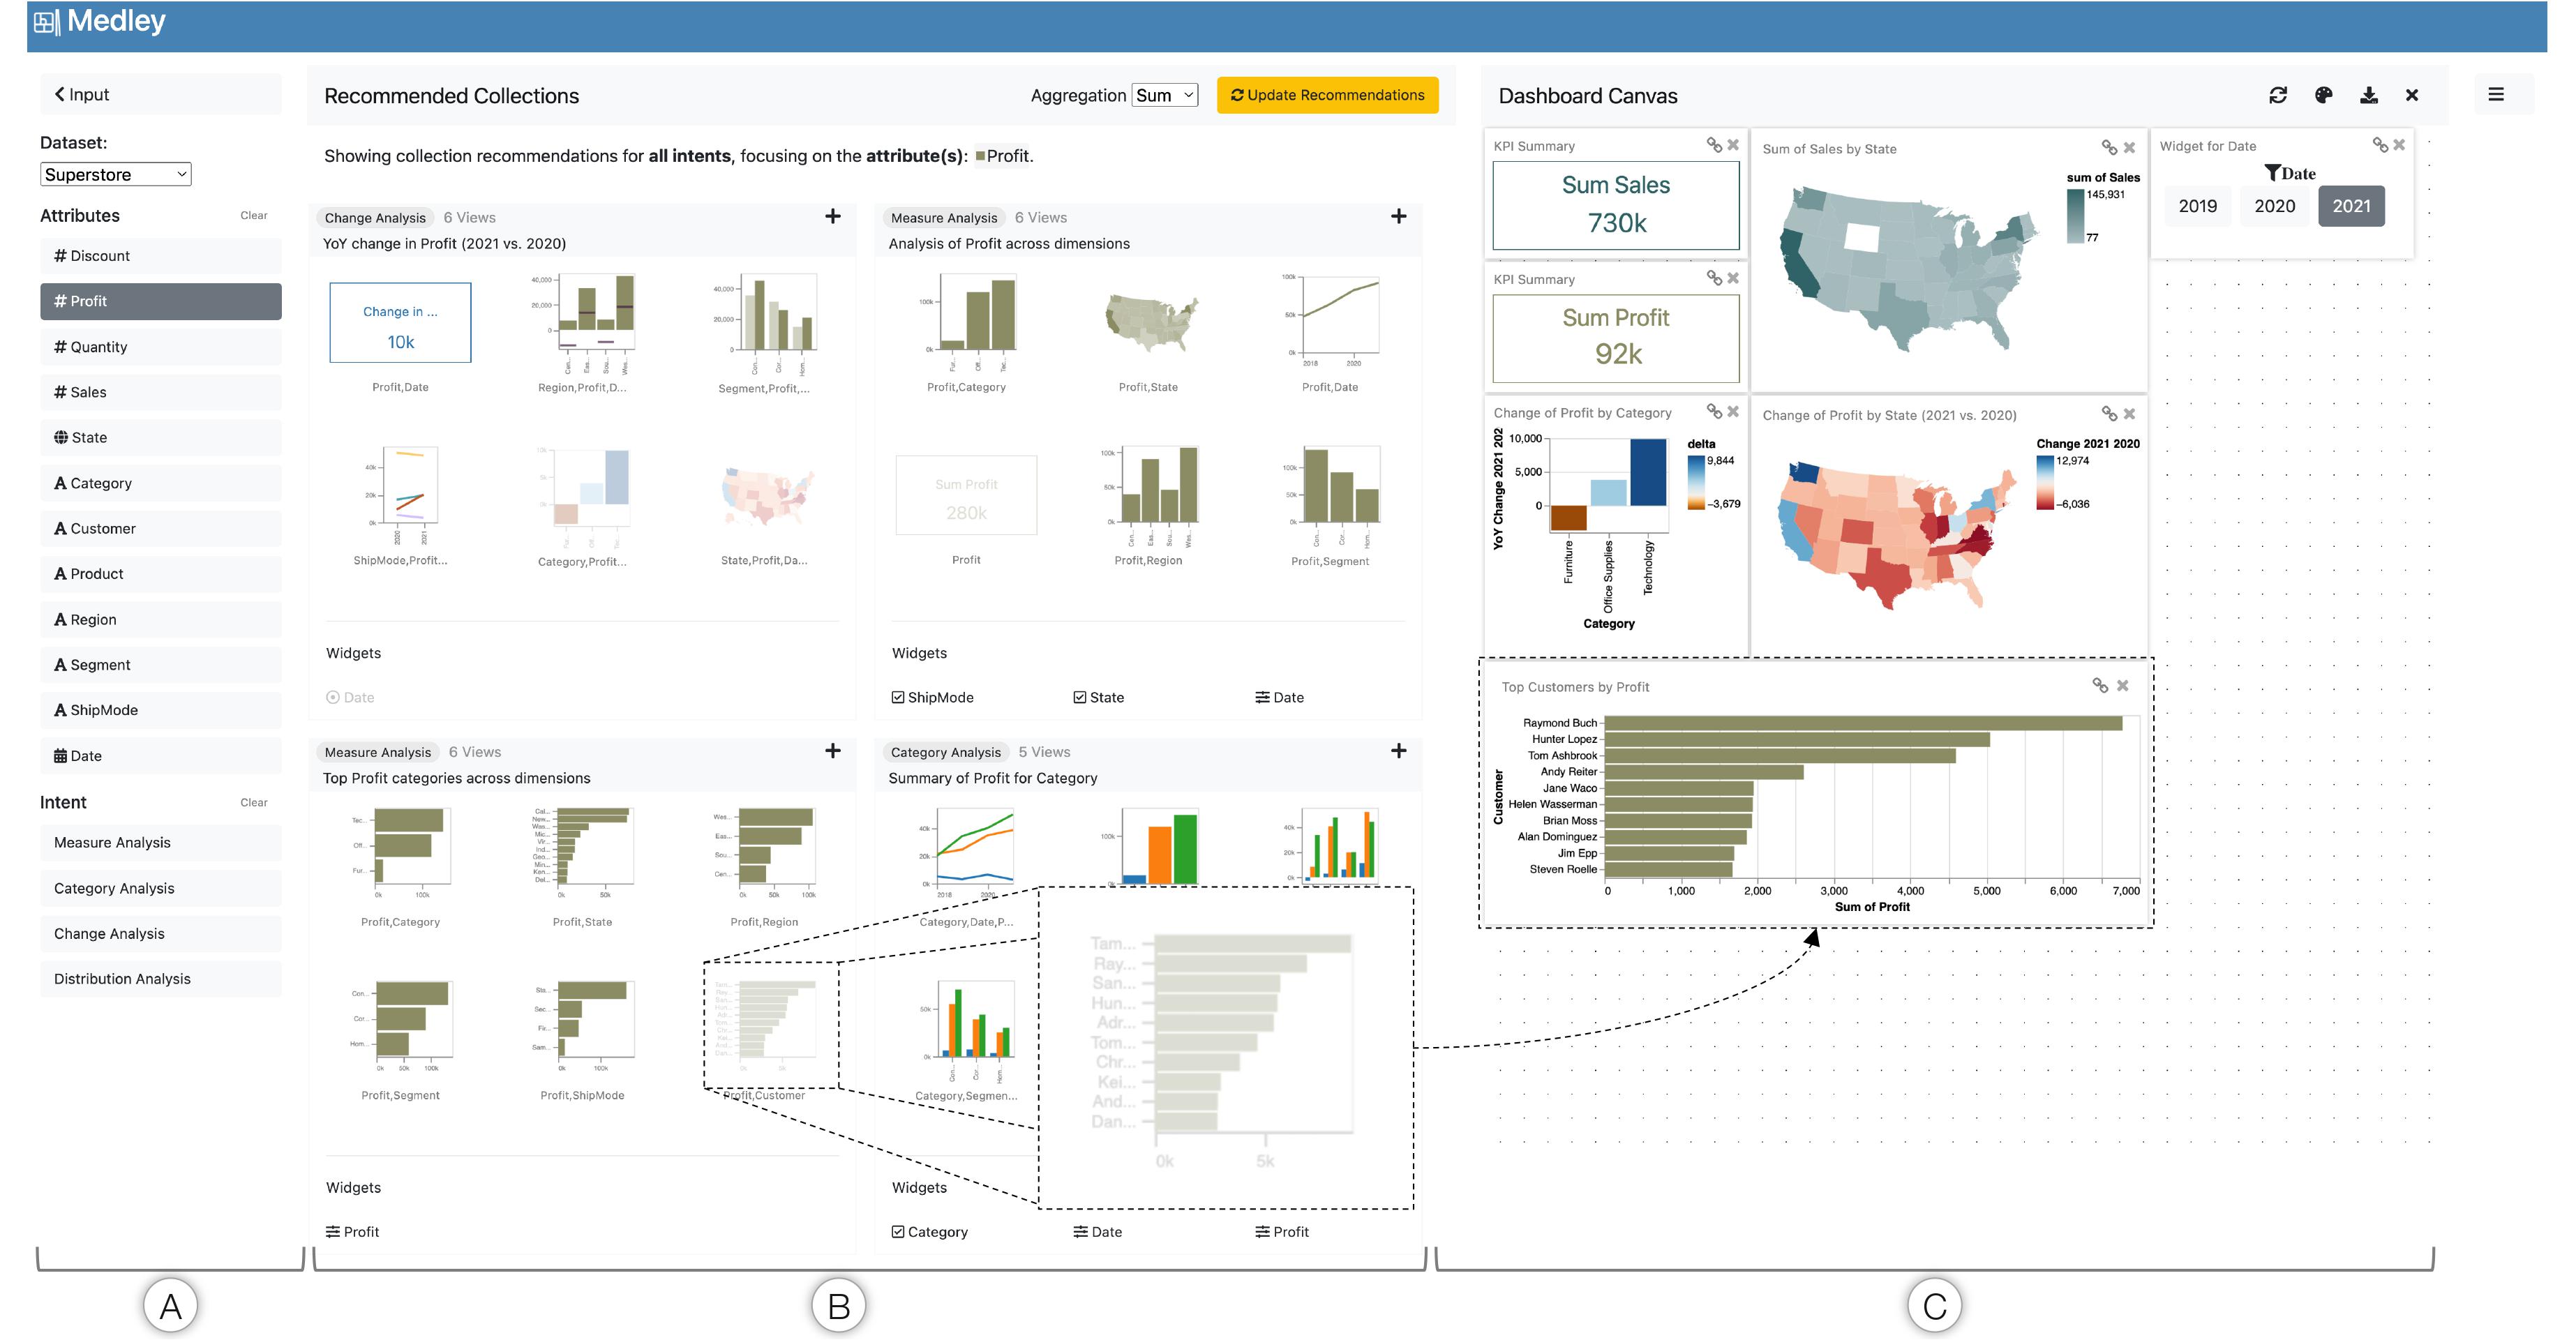
MEDLEY: Intent-based Recommendations to Support Dashboard Composition
MEDLEY is a multi-view recommendation system that assists visualization authors to generate dashboards. We surveyed 200 dashboards to understand common visualization desing patterns. With the help of this information, we created a recommendation algorithm that can translate the intent and data requirements of the user to a set of views that they can use for dashboard authoring.
IEEE Vis 2022, To appear in IEEE Transactions on Visualization and Computer Graphics (TVCG)
Paper | Video
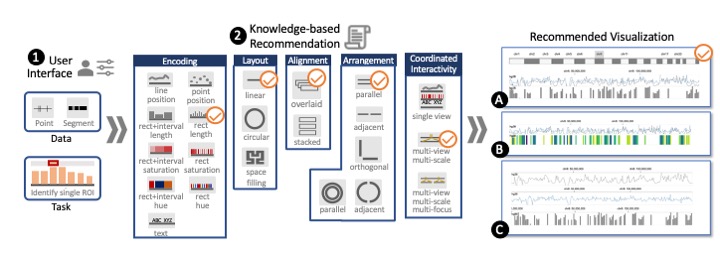
GenoREC: A Recommendation System for Interactive Genomics Data Visualization
GenoREC is a system to recommend genomics visualization. GenoREC uses data and task description from the users and suggests appropriate visualizations. GenoREC consists of two components: a knowledge-based recommendation engine that uses visualization theory to identify appropriate visualization. GenoREC's front-end provides a domain-specific user interface for users to specify their requirements and view the recommendation.
IEEE Vis 2022, To appear in IEEE Transactions on Visualization and Computer Graphics (TVCG)
Paper | Video
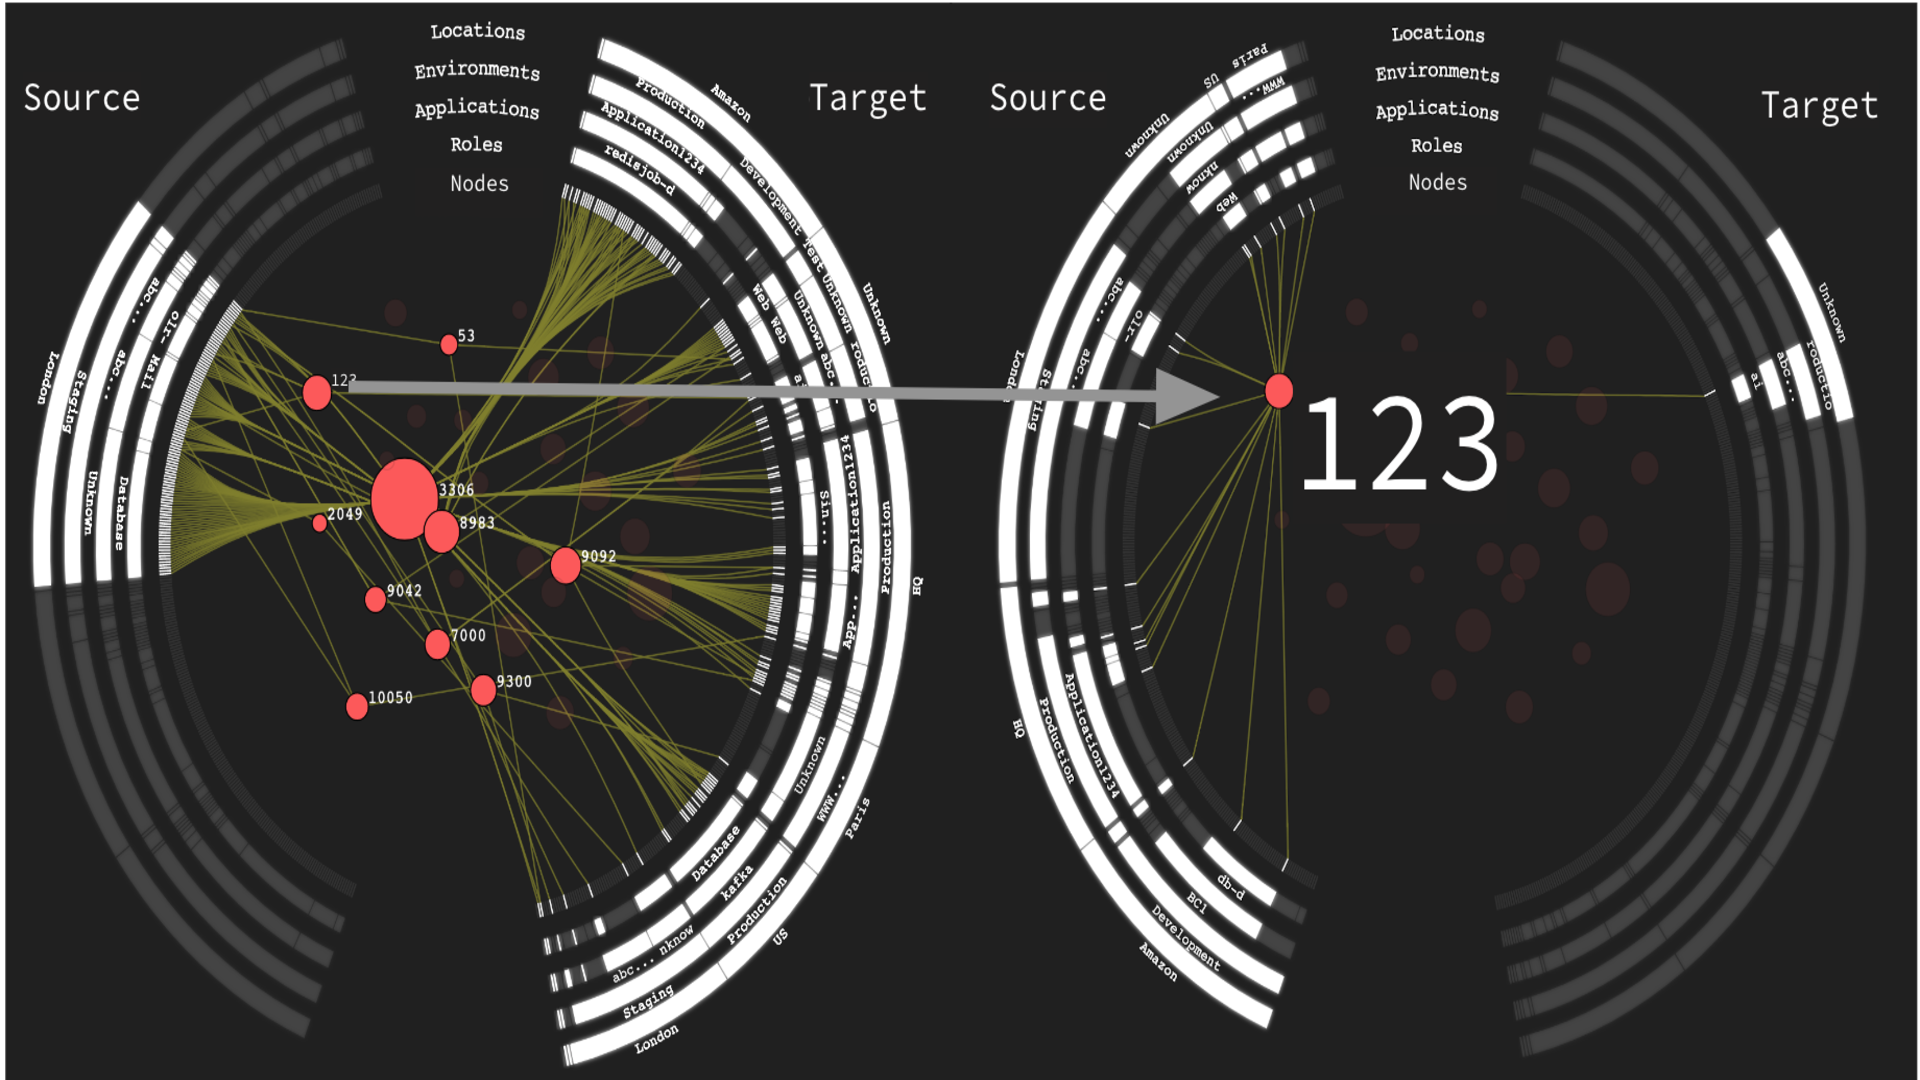
Portola: A Hybrid Tree and Network Visualization Technique for Network Segmentation
Portola is a network visualization solution that allows visibility into a segmented computer network.
VizSec 2022
Paper
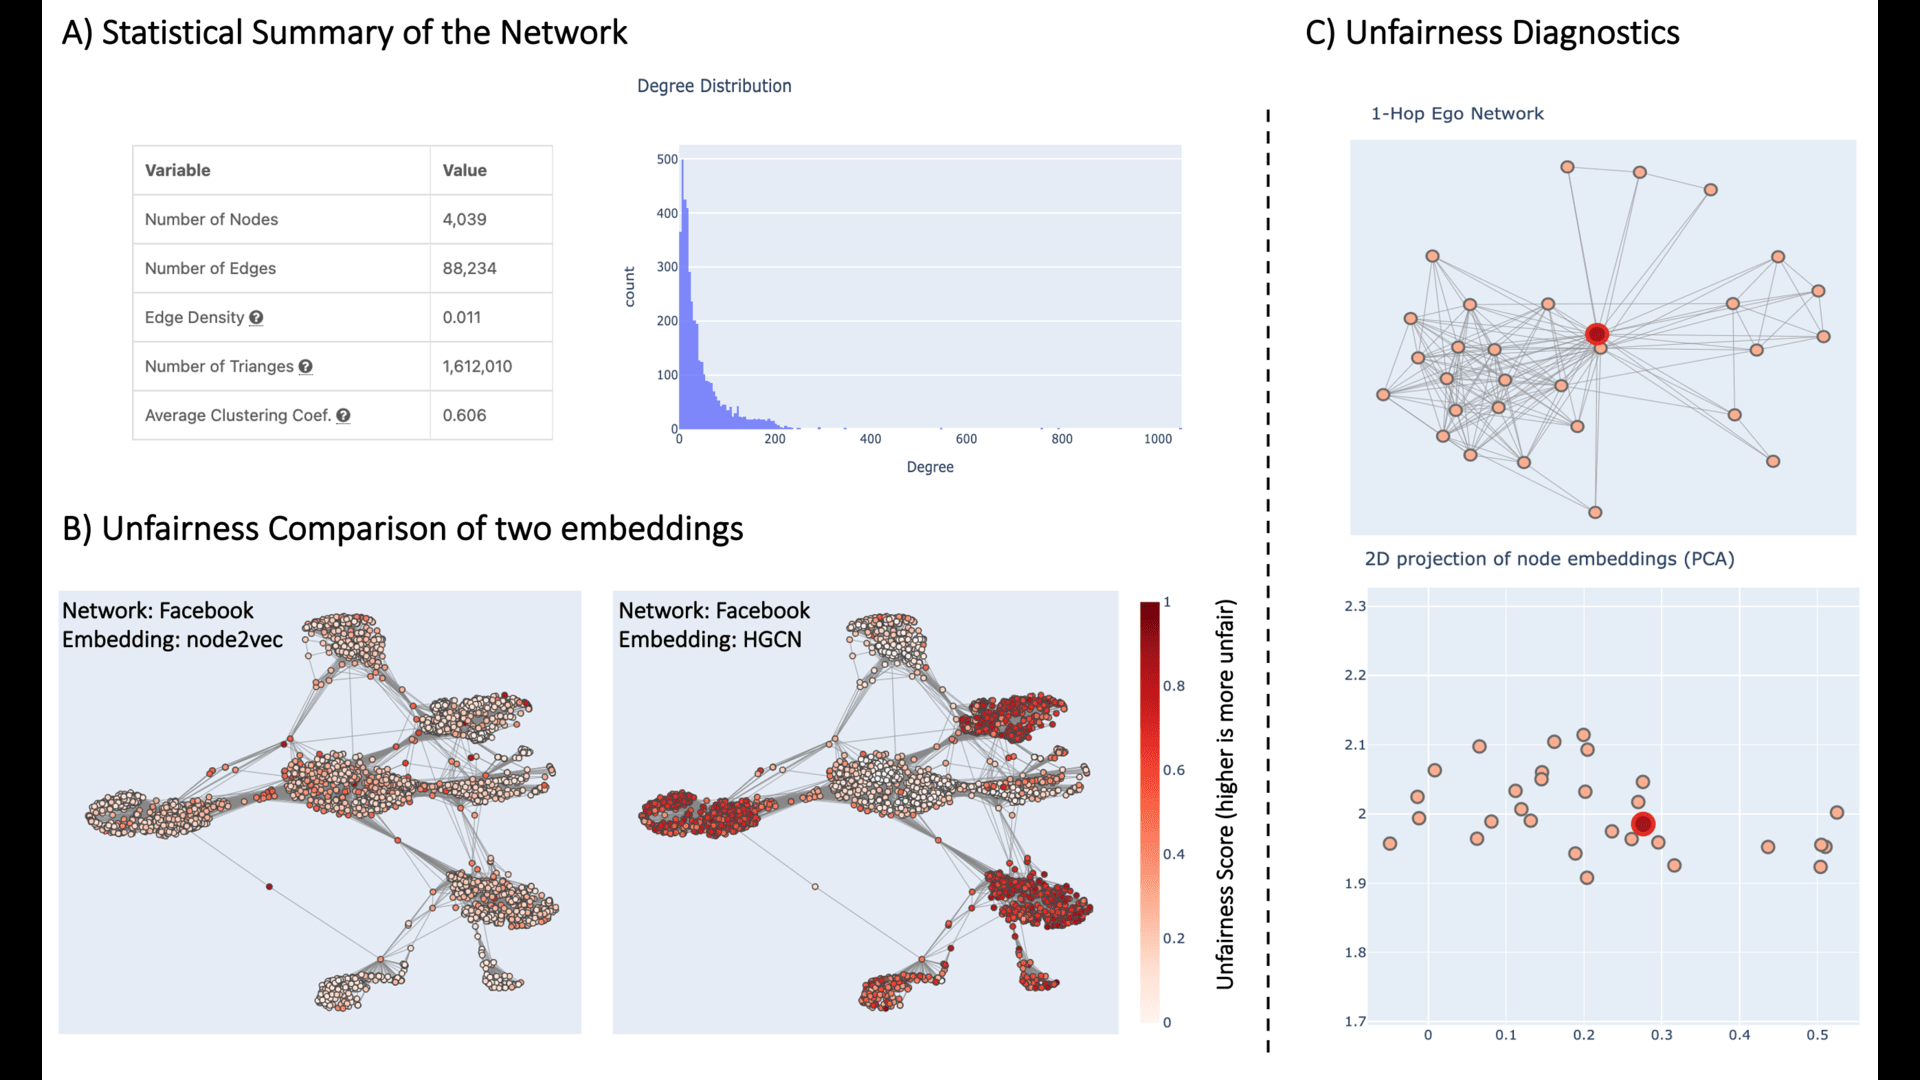
BiaScope: Visual Unfairness Diagnosis for Graph Embeddings
BiaScope, an interactive visualization tool that supports end-to-end visual unfairness diagnosis for graph embeddings. It allows the user to visually compare two embeddings with respect to fairness, locate nodes or graph communities that are unfairly embedded, and understand the source of bias by interactively linking the relevant embedding subspace with the corresponding graph topology.
Visualization in Data Science at IEEE VIS 2022
Paper
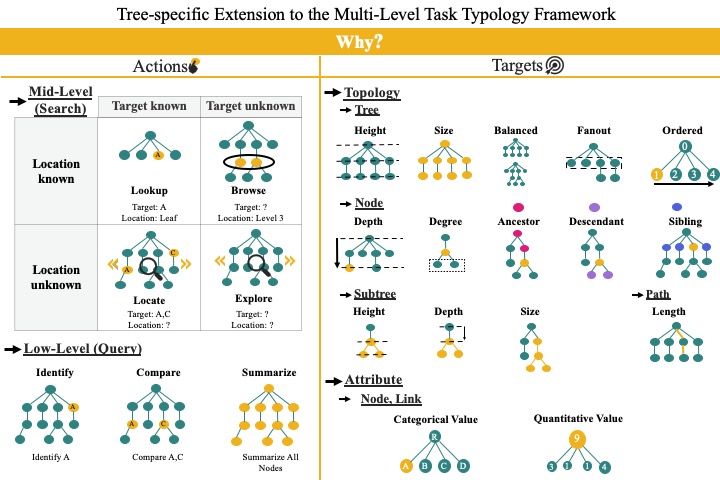
A State-of-the-Art Survey of Tasks for Tree Design and Evaluation With a Curated Task Dataset
We proposed a taxonomy to categorize analytical tasks being used for tree visualization design and evaluation. We also curated a dataset of 200+ analytical tasks from a survey of over 1000+ tree visualization research articles. A website was developed to interactively explore the results of the survey.
IEEE Transactions on Visualization and Computer Graphics (TVCG) 2021
Paper | Video | Demo | Code
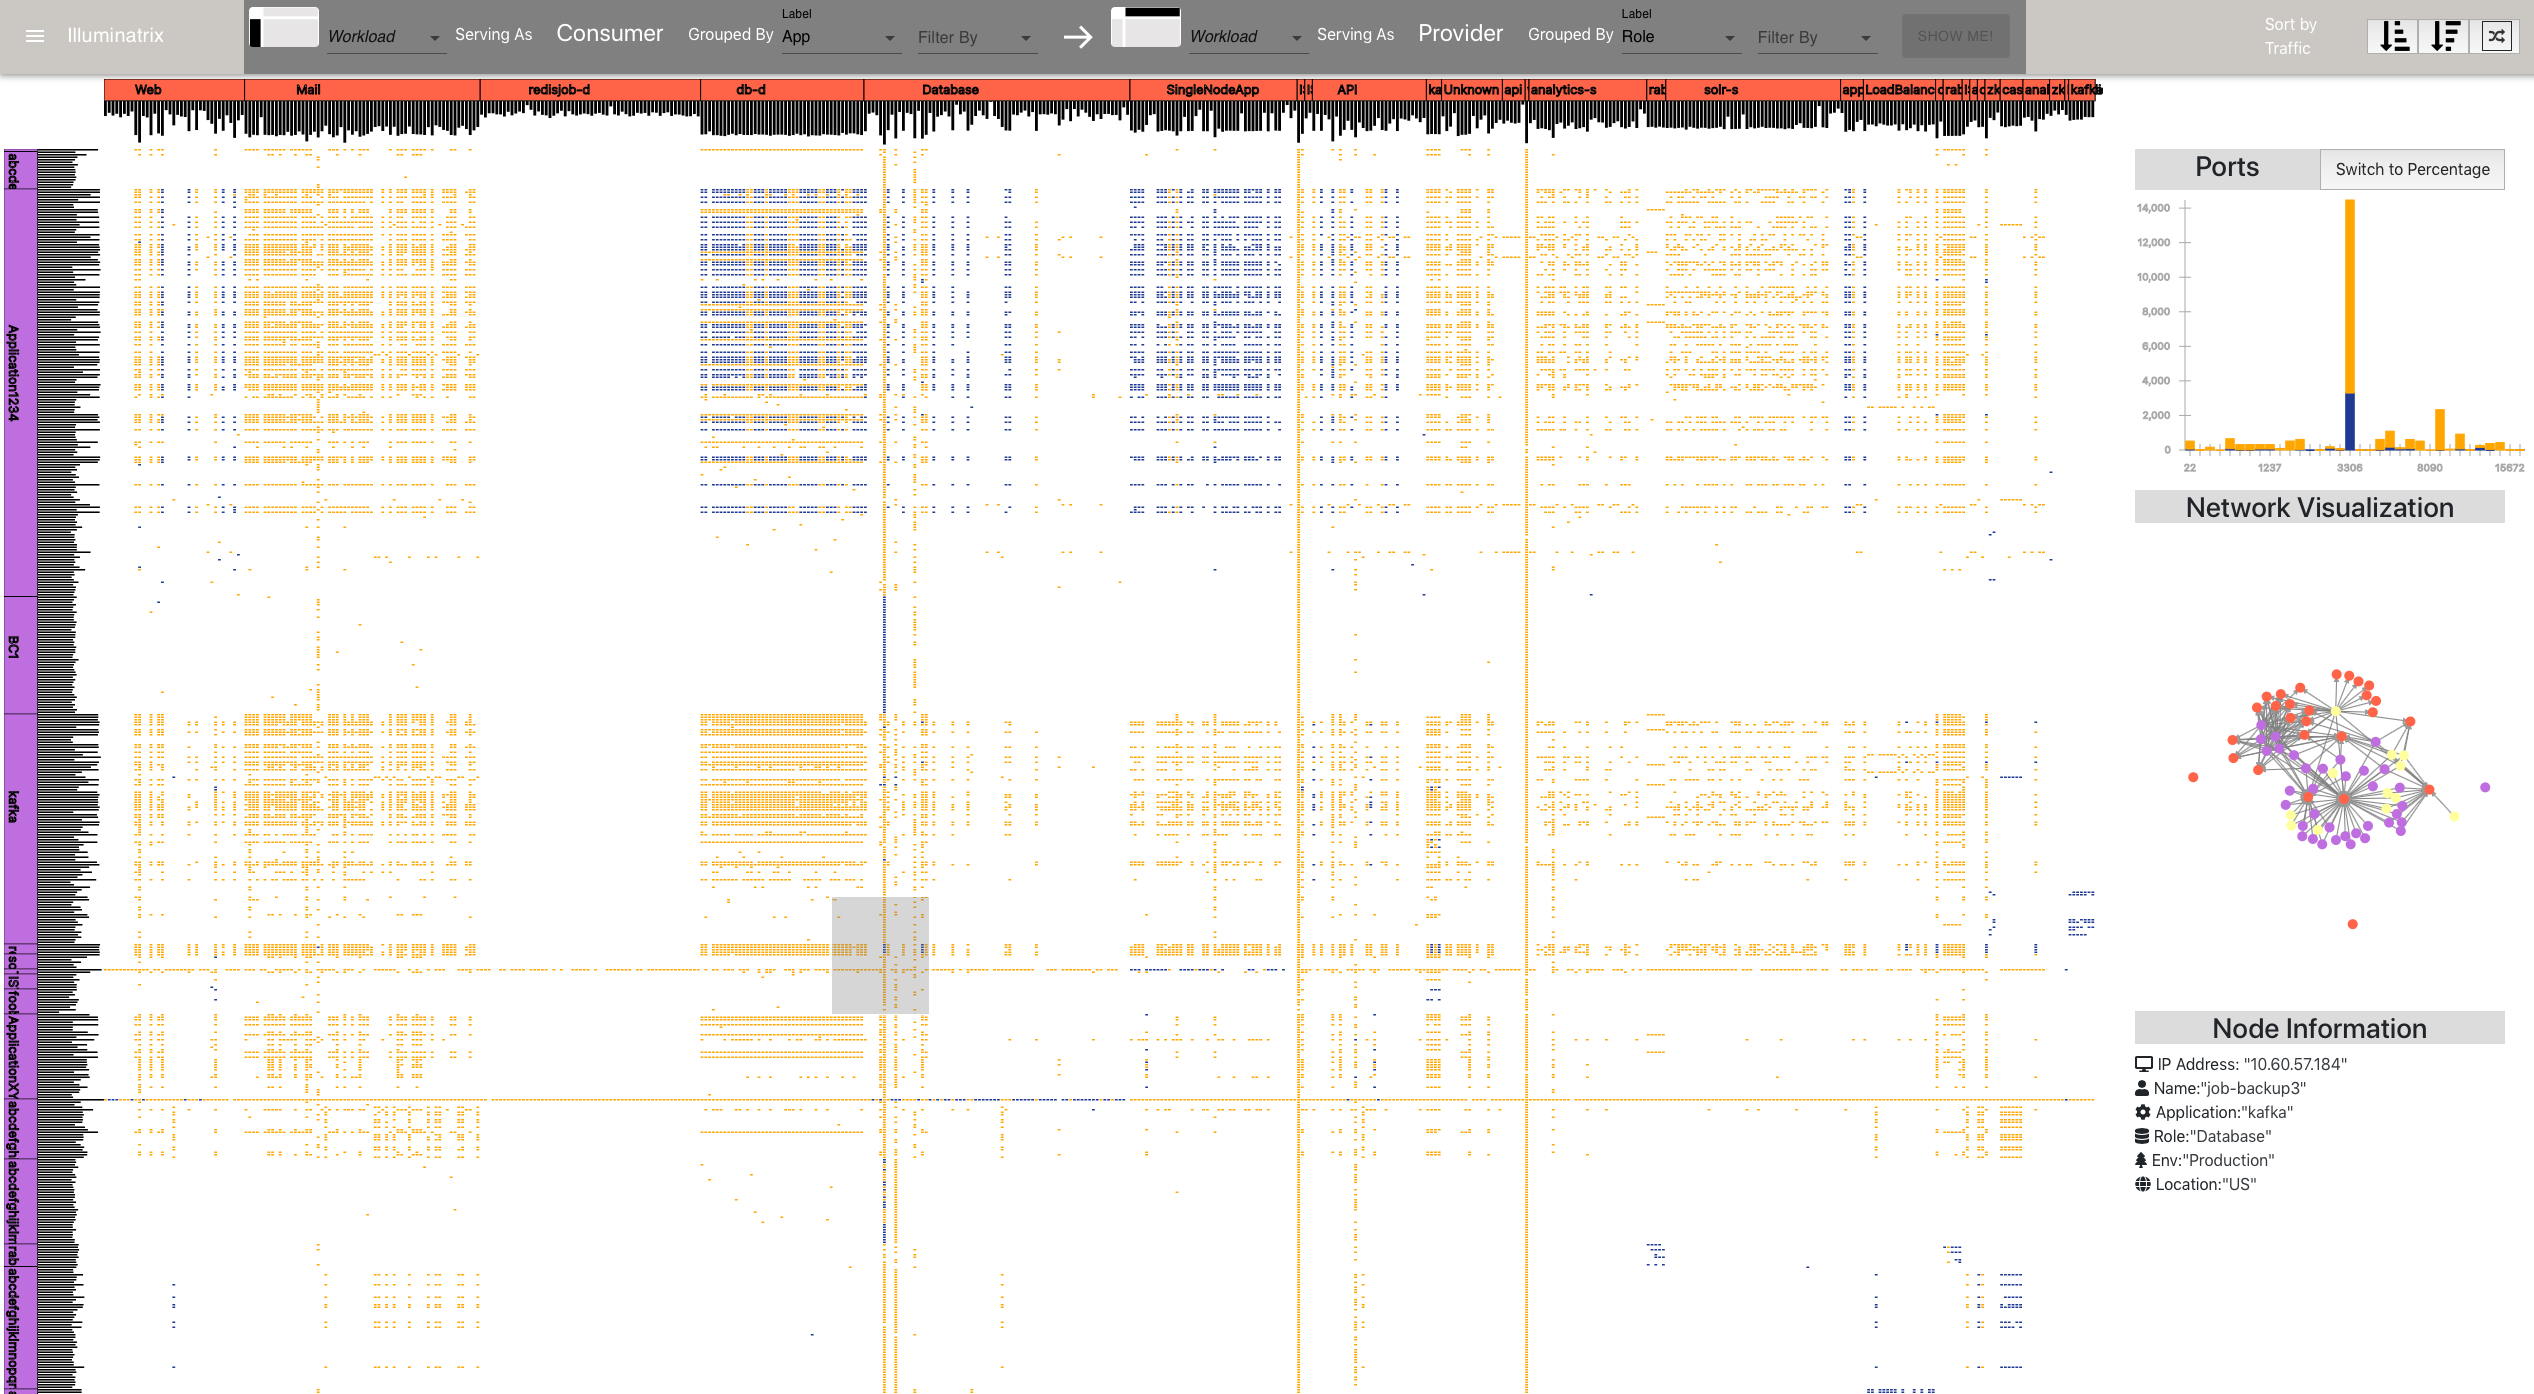
Segmentrix: A Network Visualization Tool to Develop and Monitor Micro-Segmentation Strategies
The network infrastructure of computer-based business is expanding every day. Consequently, monitoring and cyber-fencing of these massive networks is a growing concern within organizations. In this project, we developed a visualization tool which assists network security analysts to segment their network, write security policies and monitor network.
Poster at VizSec 2022
Paper | Video
CerebroVis: Designing an Abstract yet Spatially Contextualized Cerebral Arteries Network Visualization
CerebroVis is a visualization tool which assists in diagnosis cerebrovascular abnormalities like stenosis and aneurysms. We developed a novel visualization technique to display the network structure of the cerebral arteries. We found that, CerebroVis improves improves the identification of cerebrovascular abnormalities in the brain over existing 3D MRA visualization.
IEEE Vis 2019, Appeared in IEEE Transactions on Visualization and Computer Graphics (TVCG)
Paper | Video | Demo | Code
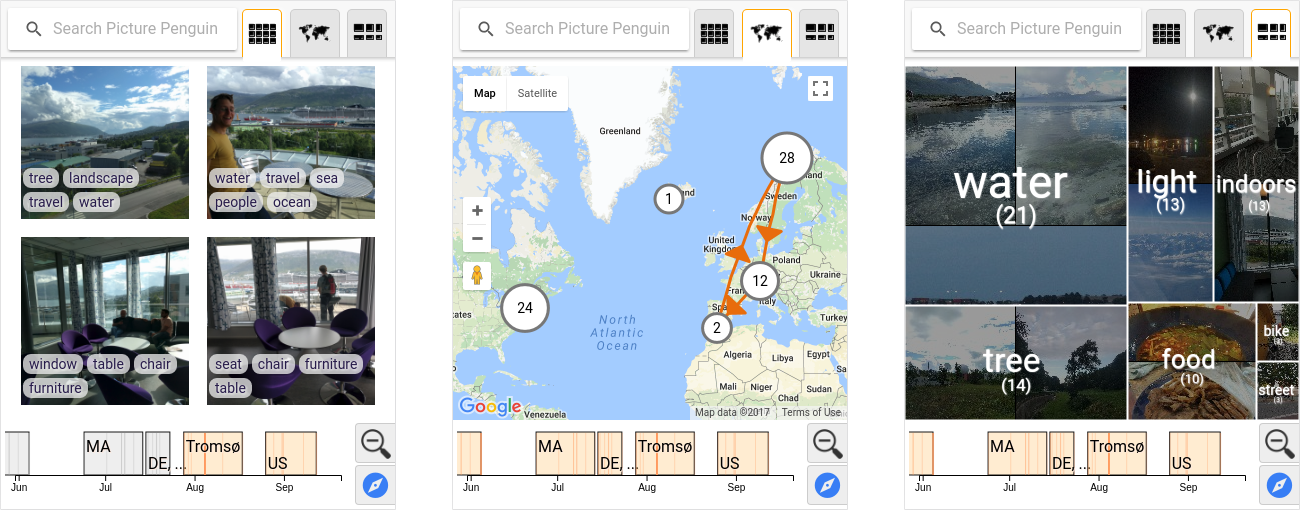
Picture Penguin
Picture Penguin is a novel personal photo navigation system that enables search and filtering through linked and combined views of temporal, geospatial, and photo content information. Picture Penguin scales to large photo collections andreduces complexity through clustering and data summarization techniques, and runs as both a mobile and a desktop application.
Video
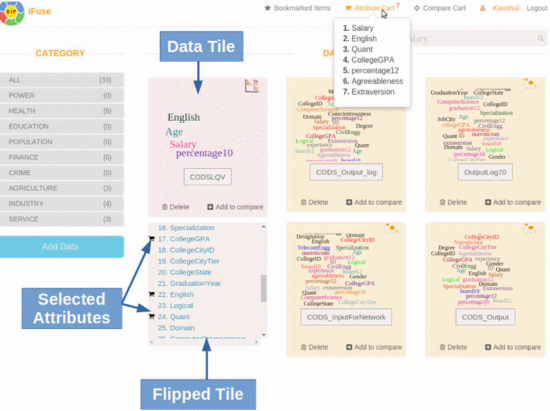
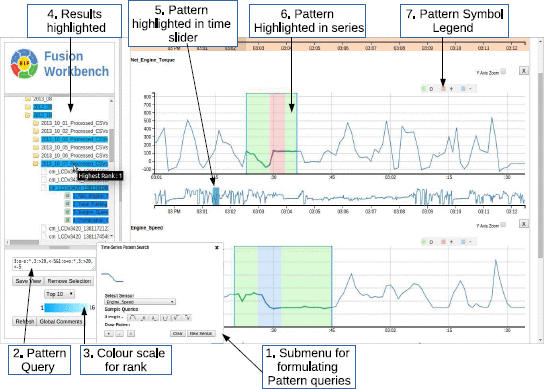
Visual Bayesian Fusion to Navigate a Data Lake
We developed a novel system for the analysis of heterogeneous data sources. The platform supports probabilistic joins for combining uncertain datasets and perform joint analysis. Within the platform we integrated a novel interactive visualization to evaluate results from Probabilistic Graphical Models.
IEEE International Conference on Information Fusion 2016
Paper | Video
VARC: Interactively Visualizing Summaries of Rules and Exceptions
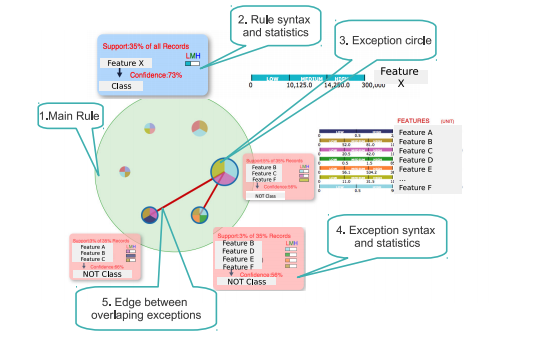
We developed a visualization tool to interactively visualize the summary of association rules and their exceptions generated from rule-mining algorithms.
EuroVA 2014